Good Monday morning! Here's your weekly market briefing — the stuff that actually matters to your buyers and sellers right now, explained like a real person (who also happens to be a little obsessed with mortgage data). No fluff. No fear. Just the facts — with a side of nerd.
📊 Section 1
Rates This Week: Hovering in the Mid-6s
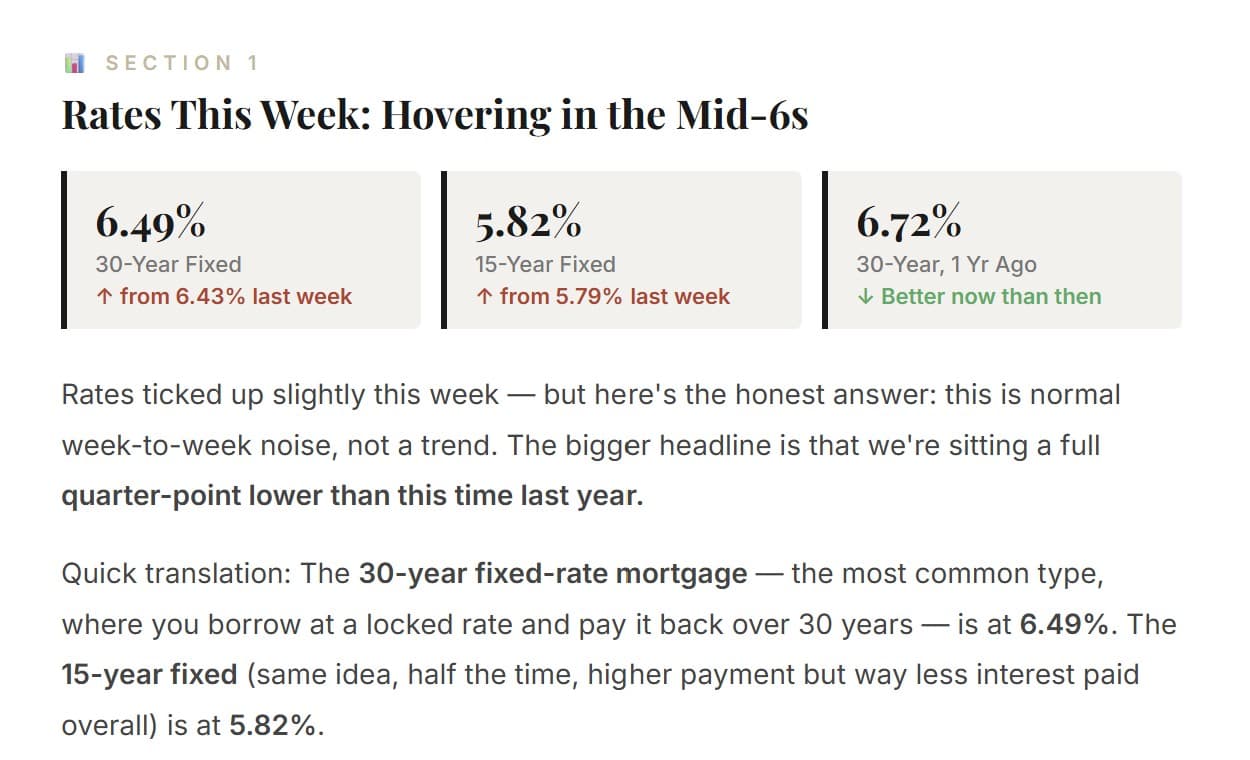
6.49%30-Year Fixed↑ from 6.43% last week
5.82%15-Year Fixed↑ from 5.79% last week
6.72%30-Year, 1 Yr Ago↓ Better now than then
Rates ticked up slightly this week — but here's the honest answer: this is normal week-to-week noise, not a trend. The bigger headline is that we're sitting a full quarter-point lower than this time last year.
Quick translation: The 30-year fixed-rate mortgage — the most common type, where you borrow at a locked rate and pay it back over 30 years — is at 6.49%. The 15-year fixed (same idea, half the time, higher payment but way less interest paid overall) is at 5.82%.
🤓 Nerd Note
The Fed doesn't set mortgage rates — they control short-term rates, while mortgages follow the 10-year Treasury bond. Think of it like two cousins: related, but they make their own decisions. Right now, both are watching inflation and jobs data closely before making any big moves.
What to tell your buyers: Rates aren't dropping to 5% anytime soon — and buyers who waited 12 months hoping for that missed real equity gains and inventory. The smartest move is getting pre-approved now and locking when the numbers make sense for their specific payment. That's the conversation worth having.
👥 Section 2
Who's Buying (and Who's Still on the Fence)
33%First-Time Buyers↑ Up from 30% last year
25%All-Cash Sales↓ Down from 29% last year
Age 40Avg. First-Time BuyerAll-time high age
The most encouraging trend: first-time buyers are slowly coming back. They made up 33% of June sales — up from 30% a year ago. That's real progress.
The longer-term picture is still complicated, though. The average first-time buyer is now 40 years old — an all-time high. People are getting there, it's just taking longer. High prices, student debt, and a few years of rate shock have pushed the first-time purchase later in life than any generation before.
The demographic reality: Millennials (ages 30–44) are today's dominant buyer group — many making their first purchase or trading up. Baby Boomers remain the largest seller group, but many are locked in at 3% rates and simply don't want to give that up. That "rate lock effect" is one of the main reasons inventory stays tight. Life events — job moves, divorces, growing families — are what's forcing most seller decisions right now.
Cash buyers are stepping back. 25% of sales are now cash (down from 29% last year), which is good news for your financed buyers — they're competing against fewer people who can skip the mortgage entirely.
🏠 Section 3
Inventory: Tight, But Not Brutal
1.56MHomes for Sale↓ Slightly from last month
4.6 moSupply (Months)Balanced = 6 months
28 daysAvg. Days on Market↓ Down from 29 last month
There are currently 1.56 million homes for sale nationally. A balanced market — where buyers and sellers have roughly equal power — needs about 6 months of supply. We're at 4.6. We're not in a frenzy, but sellers still hold some cards.
Homes are moving in an average of 28 days. Priced right and showing well? It's not sitting. And here's a positive signal: pending home sales (contracts signed but not yet closed) jumped +3.8% — meaning more buyers are actively locking up homes right now.
🤓 Nerd Note
The inventory shortage isn't just about "not enough houses being built" — it's also about "not enough people willing to sell." Millions of homeowners are sitting on sub-4% rates and have zero financial incentive to trade up into the 6s. Until rates come down meaningfully, or life forces their hand, many of them aren't going anywhere. New construction is helping, but not enough to flip the overall picture.
💰 Section 4
Affordability: Better Than the Headlines Suggest
$440,600Median Home Price↑ All-Time High
102.3Affordability Index↑ Up from 95.5 last year
500K+Jobs Added in 2026Strong labor market
The median home price just hit an all-time high of $440,600. That's the headline. Here's the part that doesn't make the headline: buyers are actually more financially capable of affording a home today than they were a year ago.
How? Wages are growing faster than home prices. NAR's Housing Affordability Index — basically, can a median-income household afford a median-priced home? — jumped from 95.5 to 102.3 year-over-year. Any number above 100 means yes, they can. We're above 100. That's meaningful progress even if it doesn't feel that way.
The real payment math: At today's 6.49% rate on a $440,600 home with 20% down (that's a $352,480 loan), your monthly principal + interest payment is roughly $2,230/month. A year ago at 6.72%? Same loan was about $2,285/month — that's $55/month less today, or about $660 back in your buyer's pocket per year. Not life-changing, but it's real — and it shows which direction things are headed.
Bottom line for your buyers: Prices are high. But wages are rising, rates are lower than last year, and the job market is solid (500,000+ jobs added in 2026 alone). Waiting for a price crash is a gamble most buyers can't afford to take. The better conversation is about which loan structure fits their life and budget — not whether to buy at all.